This article on ‘Largest Contentful Paint’ follows up on my previous post on Cumulative Layout Shift.
Webpages take time to download. They may take a long time, or they may be quick. The quicker your web page loads, the better it’s going to perform. As technology has progressed and internet connections have become faster humans have developed an increasing lack of patience. People don’t want to wait anymore.
Slow pages see high bounce rates, drops in conversions and now drop’s in position in Google. Tools exist to tell us how fast your pages are and they’ve been around for a long time. YSlow is one of the first now Page Speed Insights is a leader.
The big question is, how do you measure page loads? It’s got to be more than timing how quickly the initial HTML document downloads since so much content is now loaded via javascript, there isn’t just one object to download; there are many.
A much older and simpler measure was to count the time until DOMContentLoaded has fired. This is not valid as AJAX and background services are responsible for loading content.
LCP (Largest Contentful Paint) is another metric to measure page load times and here’s how it works.
Largest Contentful Paint explained
We can define the Largest Contentful Paint (LCP) as the time taken to display the most significant item on the page. It should load within the user’s viewport (what some call “above the fold”).
The assumption is that if you load a page, the object with the most significant dimensions is what the user will see first – or very soon after.
Each object on the page is timed and measured from when it started loading to when it loaded and finished rendering. Then the qualifying item (and there are some exclusions mentioned below) is taken as the LCP value.
Here is an example taken from BBC Cricket.
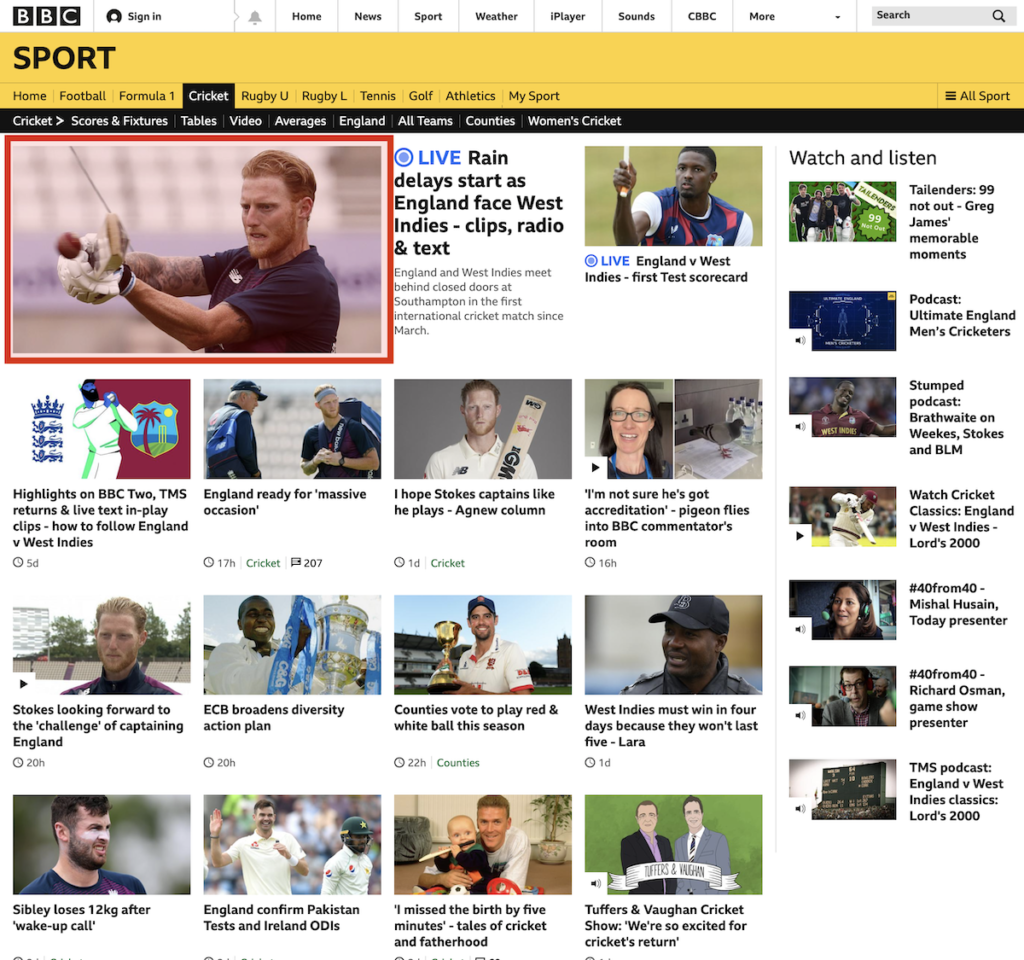
The screenshot shows the BBC Cricket home page in Chrome on the desktop with the qualifying LCP object shown in red.
There is an assumption being made that the image is relevant to the users visiting that page because it is the largest thing to be shown when the page first loads. The faster it loads, the better your user experience.
Not all of the items on the page contribute to LCP but the below are:
- images (
<img>or<image>inside<svg>) - videos (via
<video>) - images loaded via CSS using the
url()call on a background image - block elements.
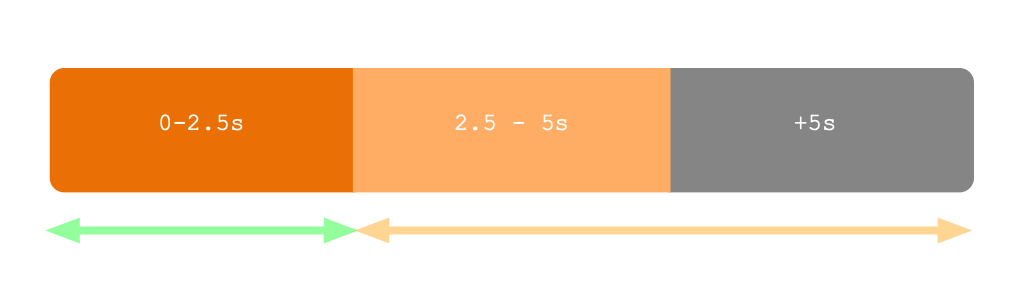
Acceptable LCP range.
Your LCP is good if it loads in under 2.5 seconds. Anything over 4 and you’re going to be missing out on users, sales and conversions. I’m confident in saying a bad LCP causes bad rankings on Google and is also costing you sales.
My rating is over 2.5s, what can I do?
Page Speed Insights will tell you the most relevant and impactful things to you can do.
I’ve given a list below of the most common factors in page load:
- Compress images and make them the required size. If you have a 350×300 image displayed on a page, show it in that size, not 1024×900 or something bigger.
- Combine and minify Javascript & CSS. If you’ve got 3 CSS files, merge them into one and the same for javascript.
- Serve assets from a CDN or different domain. If all of your assets come from www.somedomain.com, serve images from a different domain. This will allow the browser to do more work as it caps connections to a domain.
- Keep a check on web font usage and Font Awesome. They’re large and slow.
- Make sure you’re using decent web caching strategies. Avoid sending CSS and images every time over the network. Often when they change once a month, if that so use an
expirescache header. - Does that image giving you a bad LCP score need to be there? If the page achieves the same object without the image it’s probably not adding value.
Does my largest contentful paint score even matter?
Ask yourself this question: What would 38% more traffic mean to you? What does that mean for revenues? Pingdom found in 2018 that if a page takes longer than 5 seconds to load, bounce rates jump to 38%.
That means potentially 38% of people who found you, either via PPC or Google, decided to click a link coming to your website and left right after. That click might have cost you £5. They may have then pressed back and gone to the next search result and spent £37.50 on mittens for cats with your competitor.
LCP is again, modern-day SEO and Google is using this to measure that you’re giving your users a good time. However, this directly affects page speed which is directly impacting your conversion rates & bounce rates. This ultimately impacts the bottom line on a business’s health.